Section 3.4 Carbon Dynamics Working Group
|
|
||||||||||||||
3.4.1. Overarching Science Questions and Objectives
The overall objective of the Carbon Dynamics Working Group (CDWG) is to understand how the magnitudes, fates, and land-atmosphere exchanges of carbon pools in Arctic and Boreal Region (ABR) ecosystems are responding to environmental
changes and the biogeochemical mechanism driving these changes. Projects within the CDWG will fill several key knowledge gaps focused on how changes in vegetation, disturbance regimes, and permafrost thaw will alter the storage,
transport, and exchange of carbon between terrestrial and aquatic ecosystems and the atmosphere. These project span scales from plot-level studies that provide process-level understanding of relevant drivers of carbon cycling
to regional-scale measurements from airborne, tall towers, and spaceborne platforms. New remote sensing and geospatial data products combined with modeling activities will support quantification of CO2 and CH4 fluxes across
the ABoVE region. The CDWG will primarily address Tier 2 Science Objective 6:
Elucidate how climate change and disturbances interact with above- and belowground communities and processes to alter carbon biogeochemistry, including release to surface waters and the atmosphere. Research by the
CDWG will also examine impacts of snow distribution on carbon biogeochemistry (Objective 4) and greening and browning trends and their impacts on ecosystem form and function (Objective 5). Projects in the CDWG fall into several
broad categories, focused on carbon cycling consequences of: 1) disturbance, 2) permafrost thaw, 3) hydrologic changes, and 4) vegetation changes, and will also 5) examine large-scale patterns of and spatiotemporal variability
in carbon fluxes in order to 6) assess terrestrial feedbacks (and associated uncertainties) to climate (Table 1).
Table 1. CDWG key science themes and questions.
| Theme | Questions to be addressed | Groups | Obj. |
| Disturbance | How does disturbance affect land-atmosphere carbon emissions including carbon uptake through changes in growing season length, vegetation communities and plant productivity and carbon loss from soils? | Gamon, Natali Kimball Rogers Miller/Potter |
4, 5, 6 |
| Permafrost | How does landscape warming and permafrost thaw affect emissions of CO2 and CH4 from land and inland waters, and regional land-atmosphere carbon exchange? | Kimball, Meyer Moghaddam, Natali Striegl, Wilson Miller/Potter |
6 |
| Hydrology | How do hydrological changes affect growing season length, plant productivity, carbon inputs to and processing in inland waters, and land-atmosphere carbon exchange? | Striegl, Gamon Moghaddam Kimball Miller/Potter |
6, 5 |
| Vegetation | How do vegetation changes affect land atmosphere carbon exchange? | Munger Gamon Miller/Potter |
6, 5 |
| Spatial-temporal patterns | What environmental parameters optimally explain the observed spatiotemporal variability in carbon flux patterns? | Miller/Potter Gamon |
6 |
| Data-model integration | How vulnerable or resilient are ABR ecosystems to environmental change and what are the uncertainties associated with terrestrial feedbacks in the ABR to climate? | Fisher Miller/Potter |
6 |
2a. Synopsis
Of the 13 projects in the CDWG, eight will involve collection of new field-based data and more than half of the projects will rely
on pre-existing or ongoing data collected through other projects (e.g., CALM, Ameriflux and other eddy covariance sites; Table 2). The main variables that will be measured include: 1) carbon fluxes:
plot-level from terrestrial and aquatic sites, eddy covariance, and tall towers; 2) soil and water carbon pools and chemistry; 3) meteorology; 4) water environmental parameters, including temperature, moisture, pH; 5) thaw depth
and snow depth; 6) optical phenology; 7) soil biophysical data, including active layer, water table depth, soil moisture and temperature; and 8) streamflow, subsurface geophysics, hydrological measurements. Many field sites
will be strategically located to address key science themes (Table 1), including permafrost degradation sites and fire scars, and to coincide with established field measurements and experiments. Other
field sites take advantage of pre-existing networks (e.g. flux towers sites in place for many years).
2b. Next Steps
2b1. Identify common measurements across projects and develop standardize protocols.
Some field measurements that are common across projects
include thaw depth, soil moisture and temperature, organic layer depth, and soil carbon pool sampling. To make data more widely usable and to ensure data quality, standardized sampling protocols should be developed and adopted,
when possible. Several members of the CDWG are represented on the Core Variables and Standards Working Group to ensure common measurement protocols, standard projections/datum/format, and guidelines for metadata and QA/QC.
Eddy covariance flux towers are a key source of data on carbon, water, and energy fluxes, which are critical for the development and testing of ecosystem models. Presently,
ABoVE does not support any of the flux towers within the domain. However, it will be important for ABoVE investigations to assure that flux data from non-ABoVE investigators have been processed in a standardized manner for
consistency across the domain and to ensure that flux data are archived and accessible. Similarly, other field sampling methods (e.g. proximal optical measurements) vary across the ABoVE domain, and archiving of data and
protocols will be needed to reach some of the CDWG goals.
2b2. Coordinate sampling within and across working groups
Members of the CDWG are contributing to the Core Variables and Standards Working
Group to develop strategies for data sharing and for working across data communities to establish common projection, metadata and formats. Members of the CDWG have compiled a list of eddy covariance data sets to identify
data accessibility and data gaps. We strongly recommend supporting a technician to identify, obtain, and compile flux data into a centralized database for ABoVE users.
We
also suggest an online communication tool to facilitate coordination of sampling/logistics across projects and to enhance standardization of measurements. Coordinating field sampling will also be facilitated through a map
of planned site locations and table of field sampling plans, including sampling dates.
2c. Field Data /Knowledge Gaps
An issue of immediate concern for the CDWG is carbon
flux data longevity and accessibility, which is essential for addressing key science questions. Long-term eddy flux measurements are critical for identifying and quantifying processes controlling carbon exchange in the ABR.
Active eddy covariance sites in the ABoVE domain are limited and lack of funding is placing the maintenance of these sites, including data provision, at risk. The CDWG has identified support for carbon flux data as
an issue of critical concern that will impact our research outcomes. A short-term goal will be to ensure that field site data are being collected and archived, and a long-term goal will be to ensure the sustainability of
the field flux network. Given the level of effort required to identify data availability and obtain data from flux towers, we strongly recommend support for a centralized ABoVE effort to obtain flux data from tower-sites’
lead scientists that can be accessible to ABoVE PIs. We also propose a short workshop with flux tower scientists to discuss data needs and accessibility, and identify a strategy to fill critical data gaps. The need to maintain
active sites should be balanced with the need to fill data gaps in high priority regions (e.g., southwest Alaska, YK delta) or in response to transient events (e.g., fire).
Flux
estimates from tall towers are also needed to scale process-level measurements to the region. In combination with aircraft and remote sensing data, observations from tall towers are the most effective approach for developing
quantitative large-scale understanding of biosphere-atmosphere carbon exchange. The CDWG feels that there is a critical need for year-round, regionally representative measurements by tall towers to quantify CO2 and CH4 fluxes
in the winter and shoulder seasons, and to test scalability of data from eddy flux towers and of the process-based models driven by eddy flux data.
We also identify
a need to directly involve the community of scientists managing the tower sites in this discussion. While some of these individuals are listed as collaborators on ABoVE project, they are not funded through ABoVE, and this
is particularly true for Canadian collaborators. We propose a formal mechanism to provide representation for these individual collaborators. To some extent, Ameriflux, FLUXNET and SpecNet cover most (but not all) of these
data contributors. Further discussion is needed to identify carbon flux data priorities and accessibility, and therefore, as noted above, we recommend an ABoVE flux data workshop in coordination with flux tower PIs.
We suggest an ad hoc or ongoing working group to address this need (some members of this WG have already initiated this effort in collaboration with the ABoVE Project Office – details will be updated as the group is formed
and objectives defined).
| Lead PI | Focus | Location | Field Measurements |
| Fisher | Model-data integration for uncertainty reduction in global models of AB processes | ABoVE domain | Integration of field measurements from larger ABoVE Science Team |
| Gamon | Relationship between growing season length and productivity; causes and implications of “browning and greening” | ABoVE domain, emphasis on boreal (see site list) | * Eddy flux towers and optical phenology stations for model validation |
| Kimball | Environmental controls on net ecosystem carbon budget | ABoVE domain; flux tower sites & sub-regions spanning regional gradients | * Eddy tower and chamber CO2 and CH4 fluxes for boreal and tundra sites; ** Active layer profile temperature and soil moisture. |
| Meyer | Lake CH4 ebullition associated with permafrost thaw | Lakes in AK and NW Canada | ** CH4 ebullition from lakes, thaw-bulbs and SOC; radiocarbon dating CH4 and SOC |
| Miller | CARVE-CAN: Airborne observations of C dynamics in AB ecosystems of NW Canada - | Inuvik NT and Behchoko NT | * In situ measurements of atmospheric CO2 and CH4 |
| Miller | Permafrost Vulnerability in a Seasonally Sea Ice-free Arctic | * Tower CO2 and CH4 from Fluxnet & NOAA | |
| Miller | Quantifying CO2 and CH4 Fluxes from Vulnerable AB Ecosystems Across Scales | Fox, AK | ** CO2, CH4 and CO (2015 – 2019) from the CRV tower |
| Moghaddam | Regional Mapping of Soil Conditions and Associated Impacts on Terrestrial Carbon Fluxes | Northern Alaska | *Ground network of soil and permafrost conditions; ** Carbon flux and supporting biophysical data, including active layer, water table depth, soil dielectrics within Alaska AirMOSS flight transects. |
| Munger | Data-model framework that integrates and synthesizes RS observations, atmospheric measurements and field studies to quantify changes in ecosystem structure and function that impact carbon balances. | Gridded met. model encompasses AK; case studies focused on north slope and Interior AK near Fairbanks | * Meteorology, environmental parameters (sunlight, aerosols), atmospheric trace gases, and ecosystem fluxes (NOAA; LTER, AmeriFlux); ground temperatures and active layer depths (CALM network, TSP borehole network. |
| Natali | Current and future estimates of CO2 emissions during the non-growing season | 10-14 locations across ABoVE domain | **Automated forced diffusion CO2 chambers to measured CO2 emissions and soil concentrations; soil temperature and moisture, snow depth; soil chemical characterization * Winter CO2 flux data from EC towers |
| Rogers | Carbon emissions from wildfires | Saskatchewan | ** Depth and characteristics of soil organic layers, DBH of trees, carbon, nitrogen, phosphorus content of plants and soil |
| Striegl | Carbon cycling in, export from, and emissions by inland waters | Discontinuous region? | **Characterization of dissolved C (terrestrial biomarkers, FTICR-MS, 14C, DOC, DIC, degradability) in permafrost, soil pore water and aquatic ecosystems; streamflow, subsurface geophysics, hydrological measurements |
| Wilson | Characterizing carbon emissions from thawing permafrost | Fairbanks, AK | ** Ground-based measurements of CO2 and CH4 (methods?) |
3.4.3. Remote Sensing
3a. Synopsis
All of the projects in the CDWG will rely on geospatial and remote sensing data, and most will generate new data products.
Remote sensing research is the only means of providing synoptic information about the landscape and will provide an array of map-based products that will be used for parameterization, benchmarking, calibration, and validation of
modeling activities as described in the next section. The remote sensing products will have a variety of spatial scales and temporal sampling frequencies, as needed by the specific models. The spatial resolutions are also, in most
cases, dictated by the physics of the remote sensing modality and the available sensors; these range from tens of meters to several kilometers. The remote sensing data sources include optical (photography, multispectral/hyperspectral,
laser), infrared, and microwave (synthetic aperture radar (SAR) and scatterometer) modalities, and include airborne and spaceborne platforms. The spatial domains covered by these products vary, depending on modeling needs, data
availability, and/or cost of data acquisition, and can be revisited and fine-tuned based on the needs of ABoVE. The remote sensing products that will be generated from CDWG research activities are detailed in Table 3 and summarized as follows:
- Maps of vegetation type, growing season length, and gross primary productivity at 1-km resolution throughout the ABoVE domain
- Maps of lake area change and CH4 ebullition at tens of meters of resolution throughout the ABoVE domain
- Active layer characteristics, including thaw depth, soil moisture, and organic layer thickness, at tens of meters of resolution, at several transects throughout the ABoVE domain.
- Depth to water table, at tens of meters of resolution, at several transects throughout the ABoVE domain.
- Fractional open water and surface inundation dynamics at 1-km resolution throughout the ABoVE domain
- Surface freeze-thaw dynamics at 1-km resolution throughout the ABoVE domain
- Carbon dioxide and methane total column and flux estimates over the Mackenzie Basin
- Various combinations of above to produce time-series dynamics and spatial multi-scale products
3b. Remote Sensing Product Calibration/Validation
3b1. Ground Validation
All of the remote sensing (RS) products listed above must be properly validated and their accuracy assessed through
uncertainty analyses where applicable. Validation will be primarily via comparing the RS-derived product with ground observations. As the products will have different spatial and temporal validation needs, the plans for validation
should be coordinated among ABoVE science teams. We also recommend the development of spatial sampling strategies for RS and in-situ data based on, e.g., stratification analysis, which can be organized by a data coordination
working group. The working group should also address method intercomparison when multiple approaches are used for measuring the same quantity and recommendation of one method (if possible) going forward.
Some specific validation requirements are listed below:
- Maps of vegetation type: validate with ground observations of land cover over grid sizes that are meaningful for RS resolution cell sizes and a judiciously chosen subset of RS flight lines. The observations themselves are rather straightforward, but the challenge is in defining the proper sampling strategy. The ground sampling activities of the FS/FIA and BLM will be of great value to the RS validation activities.
- Maps of lake area change and CH4 ebullition: validate via repeat annual observations of a small number of lakes, recording GPS coordinates of contours of such lakes and in situ measurements of CH4 ebullition.
- Active layer characteristics, including thaw depth, soil moisture, and organic layer thickness: validate through ground measurements with an active layer probe, meter stick, and hand-held soil moisture probe, simultaneous with airborne radar overpasses at as many locations as possible during the flights.
- Depth to water table: validate using similar approach as active layer properties. For both categories, permanent soil moisture and temperature stations will also be extremely useful for providing in-situ data because it is not feasible to provide a large number of manual measurements during the overflights.
- Fractional open water and surface inundation: validate via repeat annual observations of a small number of water bodies of various sizes, recording GPS coordinates of their contours.
- Surface freeze-thaw dynamics: validate using data from permanent in-situ stations with sensors for surface temperature across a sampling grid.
- Carbon dioxide and methane total column and flux estimates: validate using in situ measurements from flux towers, plot-level chamber measurements and atmospheric airborne measurement
3c. Remote Sensing Data/Knowledge Gaps
3c1. Airborne Remote Sensing
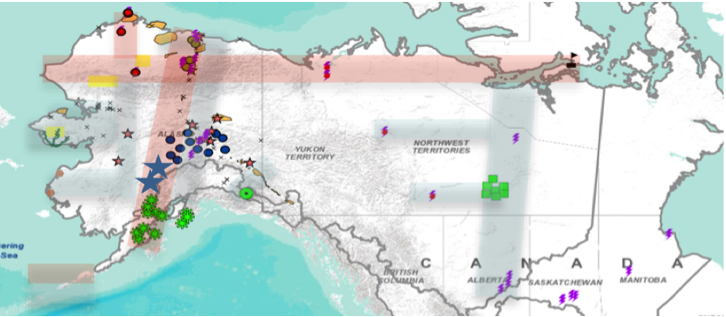 Figure 1. Recommended airborne flight line extent within the ABoVE domain.
Airborne remote sensing will be a key part of the ABoVE campaign. Based on the discussions during the 2nd ABoVE science team meeting, the highlighted areas shown on the notional map of Figure 1 are the recommended coverage area for the airborne campaigns. Not all of the airborne instruments will have the capability of covering the entire suggested swaths, but should be made to cover as much of the area as possible (see Airborne Science WG section).
Airborne remote sensing needs:
- Snow properties (cross-disc. linkages; LiDAR/optical-IR/micro.): FMCW and IceBridge instruments; ICEsat-2
- Greening/browning (solar-induced fluorescence (SIF)/surface water/hyperspec.): Airborne campaign using imaging spectrometry and SIF will be needed to validate modeled fluxes (e.g., GPP) and to elucidate the underlying controlling mechanisms influencing changes in productivity, which may help explain “greening and browning” trends. A key question remains in SIF interpretation to distinguish the contribution of green canopy structure (APAR, which scales with fluorescence) versus down-regulation (non-photochemical quenching NPQ, which reduces fluorescence). Similarly, different interpretations and methods of extracting SIF from apparent reflectance need to be tested under operational conditions. Coordination of airborne campaigns with satellite overpasses and field measurements could greatly expand our understanding of optical signals both mechanistically and operationally.
- Active layer properties: Long-wavelength imaging radar is capable of penetrating beneath the surface to depths that are meaningful for observing permafrost active layer properties, and within such penetration depths it is sensitive to active layer soil moisture and root (or organic matter) distributions. Two distinct radar frequencies, especially when used in time-series mode, are expected to enable the retrieval of various active layer properties, including thaw depth, soil moisture, and organic layer depth. To uniquely and simultaneously retrieve complex subsurface features, multi-frequency and multi-polarization measurements are needed. While P-band SAR data can retrieve soil moisture content and active layer depth with good accuracy, they do so as long as the depth of the active layer is larger than 15-20 cm. Retrieval errors become large for smaller active layer thicknesses because the long P-band wavelengths cannot resolve the smaller layer depths. By simultaneous use of L-band and P-band observations, retrieval in shallower depths becomes substantially more accurate. On the other hand, soil moisture retrieval accuracy is decreased using L-band alone for larger thicknesses, because L-band signals lose their sensitivity to larger depth profiles and thus the deeper layers are better and more accurately resolved with the P-band data. Simultaneous measurements by the AirMOSS P-band and the UAVSAR L-band radars are therefore needed.
- Lake-bound methane emissions: High-resolution L-band polarimetric SAR measurements using the UAVSAR system are desired over specific test sites to cross-calibrate and quality control measurements from spaceborne L-band SAR sensors. Polarimetric L-band SAR data are able to detect ebullition bubbles trapped by winter lake ice on thermokarst lakes and can quantify methane emissions from individual lakes. High-resolution airborne optical RS is able to detect and quantify CH4 ebullition patches trapped in lake ice in thermokarst and non-thermokarst zones of lakes.
- Surface-to-root-zone profiles of soil moisture are important factors in carbon dynamics and can help explain “browning” and “greening” patterns. Surface soil moisture can be obtained from L-band or P-band airborne SAR instruments. For soil moisture profiles from surface to the root zone, P-band SAR has been shown to be an effective tool, with an established track record of validated products through the AirMOSS EVS-1 mission. Since the L-band and P-band SAR systems are also necessary for mapping the active layer thickness, these data will have the additional benefit of providing soil moisture profile information for the greening and browning patterns.
- Above-ground biomass is a critical component in ecosystem and biogeochemistry models, but a high-resolution, accurate, or validated map does not exist for the ABoVE domain. While it is not possible to generate such a map for the entire domain using airborne measurements, it is possible to produce high fidelity biomass and landcover maps using the already-planned dual-frequency (L+P band) radar and lidar imagery over as much of the area highlighted in Figure 1 as possible. These maps can then be used to validate products from satellite imagery (such as from PALSAR-1,2 released mosaics, Sentinel-1, and the upcoming NISAR missions).
- Trace gas aircraft measurements to describe the spatial variability of the region: These data are important for the validation of models. Airborne measurements should be coordinated with remote sensing and ground measurements. For example, airborne fluxes can be coordinated with imaging spectrometry, fluorescence imaging (SIF) and ground monitoring of optical properties, as well as with satellite overpasses.
- Detailed topography: There are currently several digital elevation models (DEMs) over the ABoVE domain, but they are not complete (do not cover the entire ABoVE domain), are at different resolutions, have different accuracies, and are generally inconsistent. It is highly desirable to have access to a high-resolution, accurate, and consistent DEM for the domain. Effort to (1) harmonize existing DEMs and (2) fill in the missing data gaps by lidar or InSAR observations is well justified.
3c2. Spaceborne Remote Sensing
- Snow properties: A range of spaceborne sensors has been used in the past to retrieve snow parameters such as snow depth and snow water equivalent (SWE). These sensors largely focused on the microwave part of the spectrum and included passive microwave sensors (starting with ESMR, continuing through SMMR, SSMI, and AMSR-E) to derive low-resolution hemispheric and global SWE products and active microwave radar for higher resolution computation of SWE from backscatter measurements. Research should be conducted on the utility of modern SAR technology (e.g. short wavelength sensors such as TerraSAR-X and Cosmo-Skymed) to estimate snow properties for large areas of the ABoVE domain.
- Greening/browning: Surface soil moisture over moderately vegetated terrain of up to 5 kg m-2 of vegetation water content can be obtained from L-band satellite sources such as SMAP, albeit with coarse resolution. Airborne campaigns (coordinated with ground sampling) could assist in understanding how best to downscale these satellite signals over the vast ABoVE domain. SMAP currently has no validation sites within the ABoVE domain, and therefore provision of validation data for SMAP will also be of great value to the validation efforts of the SMAP mission. Surface soil moisture for areas of low vegetation (less than 1 kg m-2 of vegetation water content) are also possible from C-band satellite SARs such as ESA’s Sentinel-1A, whose data are openly available and can be used over a substantial portion of the ABoVE domain (such as the north slope). Subsurface soil moisture profiles to the root zone cannot currently be observed from space, because longer wavelength radars, such as P-band, are required to penetrate to depths of more than 5 cm. The ESA BIOMASS mission, scheduled for launch in 2020, will operate in P-band, but it will not have permission to transmit in north America and will therefore not cover the ABoVE domain. A future NASA SAR mission at P-band may have a better chance of obtaining such permission, though this is speculative.
- Active layer properties (dual freq. SAR): Active Layer Thickness (ALT) is an essential climate variable to monitor permafrost status. It is crucial to understand permafrost dynamics, ecology, biogeochemistry, fire disturbance, etc. InSAR observations from past (ERS-1/2, Envisat, Radarsat-1, ALOS PALSAR), current (Sentinel-1, ALOS-2 PALSAR-2) and future (SAOCOM, NISAR, RCM) C-band and L-band spaceborne SAR systems offer a potential novel way to estimate ALT over wide areas by measuring the seasonal heave and subsidence when the surface soils freeze and thaw (1-4 cm per year), and inferring the ALT if proper and unique correlations between the two quantities can be shown. Figure 2 shows an example of ALT estimates for the Barrow, Alaska area inferred from ALOS PALSAR L-band SAR data (Schaefer et al., 2015). More research into the use of InSAR data for ALT mapping is needed to determine the accuracy of these maps and to assess error sources and limitations. Note this data is archived at the ORNL DAAC (link to product on project profile).
- Lake-bound methane emissions: Fully polarimetric SAR measurements from spaceborne L-band SAR sensors (ALOS PALSAR) were found to be an effective tool for estimating lake-bound methane fluxes emitted from arctic thermokarst lakes. Future work should be dedicated to the analysis of the contribution of upcoming SAR systems such as SAOCOM and NISAR to this research field. An extension to other wavelength (e.g., C-band from Sentinel 1) should also be tested to improve spatial and temporal sampling of the phenomenon. Future work can also use single-polarization L-band SAR data, which also shows a correlation with ebullition bubbles trapped by lake ice. Additionally, optical RS data are useful for mapping lake boundaries with their change over time.
- Inundated wetlands: Wetlands have a critical role in the cycling of carbon, in particular methane. Their extent and type may be changing considerably as a result of climate variability in northern latitudes. Inundated and vegetated wetlands of Alaska and western Canada have been mapped quite successfully using spaceborne L-band satellite imagery, namely, the JERS-1 satellite in the 1997-1998 time frame, and the ALOS/PALSAR in the 2007-2008 time frame (Whitcomb et al. 2009; Clewley et al. 2014, 2015). Both wetlands products are available at 100m resolution, and are being currently evaluated for assessment of decadal change over a region that includes most of the ABoVE domain. What is missing is a similar wetlands product for the current decade. Even though the data agreements with the Japanese Space Agency JAXA are restrictive, JAXA has recently released a global high-resolution radar imagery. This data set must be evaluated for its potential for generating the ca. 2015 wetlands map of the ABoVE domain. If future data sets are released by JAXA, effort must be made to produce the wetlands map from them, using the same consistent methodology as the previous two maps.
- Above-ground biomass and soil organic carbon pools: To the best of our knowledge no high-resolution biomass map currently exists for the ABoVE domain. AVHRR and MODIS have been used to generate 1km resolution maps. Local-scale higher-resolution biomass maps may also exist, but they do not span the entire domain. By using data from past, present, and future radar satellite imagery, including PALSAR-1&2, Sentinel-1A, and NISAR, it may be possible to derive estimates of biomass at 100-m resolution or better. Any such maps would need to be periodically updated to reflect recent disturbance events.
3c3. Ground Observations for Validating Remote Sensing Measurements
Strategies for coordinated ground observations will be developed once
the results from first remote sensing campaigns were produced. Activities on the development of measurement protocols are under way to support the combination of field observation from different teams. Future projects may strive
to continue existing observations time series or attempt to diversify measurements both in space and in the observed parameters.
| Lead PI | Spatial extent | Approach | RS and geospatial products |
| Fisher | ABoVE domain | Use of remote sensing products to benchmark and/or initialize model outputs and processes | Integration of RS products from larger ABoVE Science Team |
| Gamon | ABoVE domain with emphasis on boreal region | Use MODIS products (e.g., NDVI) and MODIS bands, including new chlorophyll:carotenoid indices, (CCIs) to develop a light-use efficiency (LUE) model of productivity; Compare the new LUE model to other models (e.g., MOD17 GPP products, emerging GPP products from SIF methods (OCO2 satellite sensor) | Seasonal maps of ecosystem GPP over ABoVE region at 1 km spatial resolution. Veg type maps (decid/evergreen), Maps of growing season length |
| Kimball | ABoVE domain | Link flux tower observations with CARVE CO2 and CH4 retrievals and other land parameters derived from satellite optical and microwave remote sensing to clarify surface moisture and thermal constraints to vegetation growth and soil carbon cycling; apply data within a terrestrial carbon flux (TCF) model to quantify the NECB, component carbon fluxes and underlying environmental drivers; document model uncertainties and scaling properties of critical drivers. | Develop NECB maps, component carbon fluxes and environmental drivers with daily temporal fidelity, 1-km spatial resolution and 14+ year (2003-2016) data records; regional geospatial satellite data records for fractional open water inundation dynamics, landscape freeze-thaw and surface soil moisture dynamics. |
| Meyer | ABoVE domain | Use synthetic Aperture Radar (SAR), high resolution optical RS data and GIS modeling, combined with field observations to quantify CH4 ebullition in thermokarst-affected lakes; Link SOC inputs to lakes during the past ~60 years with field- and RS observed CH4 emissions | Regional maps of lake area change, derived from 1950s black and white aerial photography, 1980s Alaska High Altitude Aerial Photography (AHAP), and 2010 era satellite imagery. CH4 ebullition & permafrost SOC stocks vulnerable to CH4 emission upon thaw; Time-series of geocoded products from SAR and optical sensors and time-series of lake boundary data. |
| Miller-01 CARVE-CAN |
Mackenzie River Basin | Aircraft campaigns to capture spatial and temporal variability of atmospheric CO2 and CH4 concentrations and total columns and flux estimates; WRF/STILT Lagrangian particle dispersion modeling and analysis tools developed for CARVE | CO2 and CH4 flux estimates for the Mackenzie basin |
| Miller-02 Seasonally Sea Ice-free Arctic |
Pan-Arctic | Use CLM4.5 and ECCO2-Darwin to model surface-atmosphere carbon fluxes during 2005-2015 for Arctic land and oceans. Transport fluxes using GEOS-Chem to create 4D atmospheric fields. Modeled fields will be compared to atmospheric CO2 and CH4 measurements from satellites (SCIAMACHY, GOSAT), air (ARCTAS, CARVE, HIPPO, NOAA) and ground (CARVE, NOAA, FLUXNET) | Surface-atmosphere carbon fluxes during 2005-2015 for Arctic land and oceans |
| Miller-03 CO2-CH4 Fluxes from Vulnerable Ecosystems |
Alaska | CO2 observations in conjunction with a geostatistical inverse modeling (GIM) framework | Monthly, 8km resolution region-wide fluxes; Monthly 50m resolution Alaska wetland fluxes; Surface soil water and freeze-thaw dynamics |
| Moghaddam | Alaska + portions of western Canada | Radar observations using the P-band Airborne Microwave Observatory of Subcanopy and Subsurface (AirMOSS) and the L-band UAVSAR instruments; permafrost soil properties will be retrieved using techniques developed for the AirMOSS Earth Ventures 1 (EV-1) mission, and will be expanded to include dual-frequency and multitemporal analysis. | Maps of soil active layer profile characteristics (active layer moisture profiles, freeze-thaw state, active layer depth, organic layer thickness, depth to water table) in AK and portions of western Canada using time series of airborne P-band and L-band synthetic aperture radar |
| Munger | Meteorological model grid centered on Alaska | The data assimilation framework can be used in two modes. Atmospheric observations in combination with meteorological transport models will be used to optimize biospheric models that predict carbon fluxes constrained by spatial information on vegetation state from MODIS, assimilated weather data, and plant functional responses derived from flux observations. Alternatively, the framework use atmospheric observations as a regional constraint to challenge any ecosystem model. | Optimized estimates of seasonal to annual carbon fluxes from selected regions. Assessment of whether long-term trends and interannual variability in CO2 and CH4 concentrations are driven by vegetation change or climate. |
| Natali | See site list | remote sensing and other geospatial data sets to link ground-based data relating land surface features and permafrost characteristics to cold-season CO2 emissions, including MODIS Terra and Aqua products (e.g. MOD13), Landsat reflectance and vegetation indices, PALSAR | Maps of surface properties of permafrost landscapes for areas studied; Multi-scale freeze-thaw products for areas studied; Cold season CO2 flux data which will 1) scale spatially and temporally and 2) include data for model benchmarking and calibration |
| Rogers | ABoVE domain | Statistical model using Landsat and MODIS reflectance (dNBR), tree cover, active fires, and other geospatial data layers, trained with all available field observations of soil and aboveground combustion | Daily 500m layers of combustion (kg C m-2) from wildfires |
| Striegl | ABoVE domain | Geophysical subsurface permafrost characterization via new ground and existing airborne surveys | |
| Wilson | MODIS and Landsat-8 Operational Land Imager and Thermal Infrared Sensor data to “scale up” field data |
3.4.4. Modeling
4a. Synopsis
While modeling is not the primary focus of all ABoVE Phase I research projects, we recognize the importance of designing
observation strategies to maximize their value for informing or challenging current and subsequent modeling efforts (described in the Modeling WG). One project (Model-Data Integration Framework, MoDIF; Fisher-01) was selected
to begin laying the foundation for the integration of field data and remote sensing products developed by the larger ABoVE Science Team with the larger global terrestrial biosphere modeling international community. Moreover,
multiple field- or remote sensing-based projects within ABoVE have modeling components, particularly in scaling up field measurements to the larger region (e.g., with remote sensing data) or in assessing critical ABR-specific
processes within local-scale models. The up-scaled products and the lessons learned from the local-scale models may be integrated into the global models of the MoDIF project, which serve to define the larger uncertainties associated
with terrestrial feedbacks to climate within international syntheses.
The CDWG will work closely with the Modeling group and the MoDIF project, which will coalesce
a suite of modeling teams to provide a meta-synthesis of global terrestrial biosphere model (TBM) requirements, parameter and structural uncertainties, and the associated data type, range, and co-variables necessary to improve
ABR-specific simulations with respect to the ABoVE Tier 2 science questions. The goals of this “team-of-teams” are to: 1) exercise and inter-compare a suite of TBMs to identify critical data gaps for informing and
prioritizing ABoVE remote sensing and field data collection; 2) develop and employ a flexible but consistent data integration, simulation, and evaluation framework for ABoVE modeling research; and, 3) build the foundational
capacity of investigators, data sets, modeling tools, and benchmarking targets for addressing the Ecosystem Services Objectives and other scaling research needed for ABoVE Phase II research activities.
4b. Project-specific modeling activities
Kimball will lead an effort applying a satellite data driven carbon model framework to improve understanding and quantification of carbon (CO2 and CH4)
fluxes and environmental controls on the net ecosystem carbon budget (NECB) over the ABoVE domain. Primary remote sensing inputs to the model include fractional open water inundation dynamics, surface soil moisture and landscape
freeze-thaw retrievals from satellite microwave sensors, including AMSR and SMAP; land cover type and FPAR from MODIS. Additional model inputs will include daily surface meteorology from both in situ weather stations and regional
reanalysis data (GMAO MERRA2, NARR). Model sensitivity to active layer properties will be examined using relatively fine scale remote sensing retrievals from AirMOSS (see Moghaddam project). The model framework will be validated
and refined using detailed biophysical measurements at regional tower eddy covariance monitoring sites. Atmospheric observations of CO2 and CH4 from the CARVE campaign (see Miller) convolved with meteorological transport
(footprint analysis) developed in the pre-ABoVE data assimilation framework (Munger) provide an integral constraint to assess landscape to regional aggregation of the modeled carbon exchange. Model simulations will be conducted
at a daily time step and 1-km spatial resolution emphasizing the recent satellite era (2003-present). The model simulations will be used to investigate and quantify regional patterns and variations in the NECB, and linkages
to changing surface conditions, including freeze-thaw (FT) regimes, soil moisture and open water inundation across the ABoVE domain. These results will be used to improve model representations of sub-grid scale processes affecting
carbon flux estimates, while incorporating regional model enhancements representing wildfire disturbance recovery, permafrost and wetland CH4 emissions.
Meyer: Will conduct talik modeling combined with site-specific Soil Organic Carbon (SOC) data to estimate permafrost SOC pool sizes eroded into lakes; regression modeling to estimate lake-bound CH4 emissions from measurements of optical and radar remote sensing data; GIS modeling to derive multi-temporal sub-regional maps of historic lake extent and recent lake area change; error modeling to accurately document the uncertainty of all derived geospatial information. Together these modeling approaches will help improve our understanding of the vulnerability and resilience of lake ecosystems to permafrost thaw with respect to the release of CH4 from decomposition of permafrost soil organic carbon.
Gamon: To address changing phenology and productivity, this team will develop a new light-use efficiency (LUE) model of ecosystem productivity, based on a combination of satellite indices provided by newly available MODIS products. This revised LUE model will be validated against flux tower data and compared to other, independently-derived products (e.g. MOD17 GPP and SIF-based estimates of GPP and phenology. The project will also employ independent, statistically-based approaches to upscale from sites to evaluate productivity over the ABoVE domain.
Miller-01, CO2 and CH4 concentration data over the Mackenzie basin will be used to estimate regional carbon exchanges using a backward modeling approach based on WRF/STILT Lagrangian particle dispersion modeling and analysis tools developed for CARVE. The basis of this approach is that observed concentrations at a receptor point are affected by upwind boundary condition and the accumulated input or depletion of CO2 and CH4 in the surface layer as air mass moves over the landscape. Conversely, the observed concentrations can be used as an integral constraint for regional carbon exchange in a forward modeling framework that uses WRF-STILT to distribute modeled emissions (uptake) and estimate downwind concentrations.
Miller-02, Sea-ice-free Arctic: This project employs Community Land Model (CLM) driven by meteorology and sea ice trends for 2005-2015 to identify emergent properties of the terrestrial Arctic. Investigate the impacts of a seasonally sea ice-free Arctic upon the state of permafrost, snow cover, talik formation, and biogeochemical cycling via a series of targeted sensitivity experiments that isolate specific forcing mechanisms and processes. The project will use CLM4.5 and ECCO2-Darwin to model spatially and temporally resolved surface-atmosphere carbon fluxes during 2005-2015 for the Arctic land and oceans, respectively. Transport these fluxes using GEOS-Chem to create 4D atmospheric fields. Modeled fields will be compared to atmospheric CO2 and CH4 measurements from satellites (SCIAMACHY, GOSAT), air (ARCTAS, CARVE, HIPPO, NOAA) and ground (CARVE, NOAA, FLUXNET). 2005-2015 retrospective analysis that quantifies changes in Arctic permafrost, carbon fluxes, and surface energy balance due to the extreme changes in sea ice extent during this period.
Miller-03, C Fluxes Across Scales: This project will use CO2 observations in conjunction with a geostatistical inverse modeling (GIM) framework to:
1) estimate net ecosystem exchange, 2) evaluate the process level representation of land-atmosphere carbon exchange inside terrestrial biospheric models (TBMs including CASA, TDF, CLM, PVPRM, CARDOMAM), and 3) identify
the environmental parameters that optimally explain the observed spatiotemporal variability in carbon flux patterns across the ABoVE domain. The project will test the hypothesis that relatively warm and wet years
result in the highest positive NEP (sink) flux totals across Alaska, particularly in the northern and western coastal locations in the state (i.e., the Brooks Range Mountains and Arctic Foothills), whereas relatively
cold and dry years result in lower (negative) NEP source flux totals statewide. The project will extend the GIM framework to evaluate TBM performance in simulating the spatiotemporal variability of CH4 flux patterns
and will extend to the present the CASA model ecosystem CO2 (including fire fluxes and regrowth) and wetland CH4 fluxes (Potter et al. 2013).
Moghaddam: AirMOSS measurements of P-band radar backscatter are being collected along Alaskan transects spanning large regional environmental gradients
in climate and land cover (tundra to boreal), collocated with in situ measurements from regional surveys and detailed biophysical measurements at regional tower eddy covariance measurement sites. The AirMOSS data are
being used with ground observations for generating geospatial maps of active layer properties, including active layer depth, soil moisture and freeze-thaw properties at approximately 100m spatial resolution. These data
will be used to inform a succession of land surface hydrology and terrestrial CO2 flux simulations to investigate the impact of permafrost soil dynamics and surface soil moisture information on regional carbon flux
simulations. Product: active layer properties within AK regional transects; model estimates and projections of terrestrial carbon fluxes, including vegetation productivity, ecosystem respiration and soil decomposition
processes.
Munger: This pre-ABoVE project is developing a data assimilation framework that combines remote sensing measurements of vegetation and land surface changes, an ecosystem modeling framework for biogenic greenhouse gases, and atmospheric CO2 and CH4 concentration measurements that integrate the atmosphere-biosphere exchange of these gases across the region. The overall objective is to assess whether changes in arctic and boreal climate and vegetation are leading to detectable large scale changes in carbon exchange. A key input to this approach, and hence critical uncertainty, is the upwind boundary condition representing the concentration before an air parcel crossed the landscape of interest. Modeled meteorology to define transport trajectories and mixed layer depths are critical uncertainties.
Natali: This field-based project will use regression models to examine key drivers of winter CO2 emissions at the plot-level and use statistical models to scale point measurements to the larger region. We will also use inverse modeling of field fluxes to determine temperature response functions and the soil depth of CO2 production.
Rogers: Statistical models will be used to estimate carbon emitted from all wildfires across the ABoVE domain from 2002 onwards. This project will also employ a prognostic carbon cycling model (either CLM or UVAFME) to estimate the rate at which individual 500 m pixels re-sequester carbon from the atmosphere, taking into account species-level succession and a suite of other local/regional drivers.
Wilson: Wilson will collect field measurements of CO2 and CH4 with permafrost thaw and subsurface structure to estimate the magnitude of changes in atmospheric greenhouse gas concentrations due to permafrost thaw. These field measurements will be used to develop a computationally-efficient parameterization of emissions from thawing permafrost for use in the NASA GEOS-5 Atmospheric General Circulation Model (AGCM), which will be used to simulate the radiance signal that ASCENDS and other types of satellites (e.g. AIRS, GOSAT) observe.
4c. Modeling gaps
Improved and adequate models are needed to spatially and temporally extend the observations described here through time and to
the ABoVE domain. Current models generally do not adequately incorporate know patterns and processes of CO2 (Fisher et al.2014) or CH4 (Melton et al. Fisher et al. 2014) fluxes, and shoulder season and winter fluxes of
CO2 (Oechel et al. 2014) are inadequately captured. For example, CH4 models driven by inundation in permafrost may underestimate methane emissions from upland and non-inundated tundra. Furthermore, CH4 models also
generally underestimate or ignore zero curtain (when the surface is frozen but the active layer hovers around 0°C) and cold season fluxes, which can be 50% or more of the annual Arctic methane emission (Zona et al. 2016).
Another critical gap is adequate ability for spatial upscaling and extrapolation across the ABoVE domain. Model development is needed for simulation, with confidence, of CO2 and CH4 fluxes over the ABoVE domain to set
a baseline carbon flux budget and to detect the effects of climate variability and change. This will require further model development, including incorporation of recent results and the results of ABoVE studies and close
collaboration and open exchange between modelers, empiricists, and experimentalists. It will also require input data, including remotely sensed data, at an appropriate spatial scale.
A
considerable fraction of the modeling effort by projects in this working group is in statistical models, spatial scaling, and parameterization. This is an essential step in synthesizing site scale information. We anticipate
that higher order process based modeling teams that by necessity operate with larger-scale landscape units will be added in subsequent phases of ABoVE in order to extend site-based understanding to the larger domain. It is
critical, however, at this stage to be considering the needs of those models and the type and scale of output that they generate. It has been the experience from other model-data intercomparison exercises that early engagement
by modeling teams and iterative collaboration between observations and modeling is the most effective approach. Process-modeling groups should be engaged as soon as possible in the CDWG to identify the needs for, among other;
(1) input driver data that may not be included in the current suite of CDWG field observations, and (2) ecosystem functional traits and initial states. As the field observations progress they need to be generating estimates
of uncertainty from all aspects of the measurement including analytical accuracy/precision, spatial variability, representativeness.
3.4.5. Connections between CDWG and other Working Groups
Several of the projects in the CDWG are examining carbon cycling consequences of:
1) fire, 2) permafrost thaw, 3) hydrologic changes, and 4) vegetation changes (Table 1), and will link to each of these Working Groups, as well as to the Modeling Group. The CDWG sees several ways
that we can synergize and leverage across groups. First, to enhance synergies among groups, we suggest an index of and pointer to existing data and relevant research activities within ABoVE as well as to related research
initiatives (e.g., NGEE Arctic). Data leveraging among groups will be enhanced through use of an interactive field map and shared data collection plans. Communication of standard protocols and data needs among groups
will also allow leveraging of field efforts. The activities can be facilitated by the Core Variables and Standards Working Group, which will work across groups and coordinate these efforts. CDWG also suggests a
dedicated fund, perhaps an interagency fund, to provide the personnel support needed for PIs to make historic data available in the prescribed format. This acknowledges that valuable data sets exist where the PI has insufficient
resources to retrieve, process, document, and transmit these data for the use of ABoVE and other programs or agencies.