This newsletter was distributed to members of the ABoVE community on May 10, 2018.

Note from Leadership:

ABoVE Science Team,

We hope you are all enjoying the onset of Spring, especially in the far north. Spring is not just a time to reflect on “shoulder seasons” and zero-curtain periods but also to appreciate the resiliency of high latitude ecosystems - and all its inhabitants - to the long cold dark period. It's a time to celebrate the initiation of new life and the wonders of the biosphere as it responds in innumerable ways to the lengthening days. In the case of ABoVE it is also a time when many of you are vigorously planning your upcoming field campaigns, and in some cases reflecting on the successes of winter campaigns (see for example the summaries in this newsletter on the excursions of Laura Prugh's and Go Iwahana's projects). It's undoubtedly a very busy time for all of you.

The ABoVE Leadership Group has been busy in many ways as well, including efforts to summarize some of what we're learning from ABoVE research. Scott, Chip and Peter have been working with the leads of the working groups, and a few other participants, to collate input from all Working Group Members of the broader science team. In this newsletter we provide a summary of what we're learning thus far, with special thanks to the WG Leads and all who contributed information and insights.

Finally, we would like to recognize Eric Kasischke's voluminous contributions to ABoVE as he heads into retirement of both his role as NASA ABoVE Project Scientist and as Professor at the University of Maryland. As many of you know, Eric initiated ABoVE as the Principal Investigator of a Scoping Study way back in 2008 entitled Vulnerability and Resiliency of Arctic and Sub-Arctic Landscapes (VuRSAL). Scott Goetz, Michelle Mack and John Kimball were co-investigators of that proposal and authors of the scoping study report that eventually led to the formation of a Science Definition Team and development of the ABoVE Concise Experiment Plan, completed in June 2014. Eric has accomplished a great deal by being instrumental to both the development and implementation of ABoVE writ large. For those of you who missed Eric's “farewell” presentation at the Science Team meeting in Seattle, you can at least view his slides on The Boreal Arctic Research Continuum–Reflections of an Old Timer. We owe a deep debt of gratitude to Eric and expect he will continue to provide important insights and welcome advice from his Montana homestead.

Scott, Chip, Peter and Hank

NOTICE: Terrestrial Ecology Research Announcement in ROSES-2018


Notice of Intent Due: June 18, 2018
Proposal Due: September 7, 2018

More Information

Airborne Campaign Upcoming Flights in 2018


NASA is planning to conduct AVIRIS-ng flights in mid-summer 2018 and 2019, and L-Band SAR flights in late August of 2018 and 2019. AVIRIS is tentatively scheduled to fly sites around Fairbanks, Barrow, and the Mackenzie Delta. L-Band SAR will be repeating lines flown during the 2017 campaign, with the objective of establishing multi-year time series for ABoVE science investigations and is tentatively scheduled to fly the BERMS site in Saskatchewan, road-accessible sites near Yellowknife and Inuvik, and a subset of sites in Alaska and Yukon that are of greatest interest to the SAR Working Group. Notional flightlines, subject to modification, will be posted as this planning progresses.

More Information

What we are learning from ABoVE Research

Photo courtesy of Glenn Juday, taken from Parks Highway overlook 22 September 2015


Authors: Natalie Boelman, Abhishek Chatterjee, Roisin Commane, Scott Goetz, Mike Goulden, Peter Griffith, Joshua Fisher, John Kimball, Michelle Mack, Chip Miller, Sue Natali (authorship is alphabetical order reflecting equal contributions to this effort). We thank all the WG members who contributed input and ideas.

The Working Group Leads and Science Leadership Group (SLG) have been assessing input from members of the primary science working groups (Carbon Dynamics, Fire Disturbance, Permafrost and Hydrology, Vegetation Dynamics, Wildlife and Ecosystem Services, and Modeling), with the goal of summarizing what we are learning from ABoVE research efforts thus far. Each WG lead surveyed their group for input and then, working with one another and the SLG, combined input on various themes to highlight some key areas of progress. The following summary is not meant to be exhaustive but rather a brief overview of some of what we're learning and why it matters. Part of the criteria was one or more refereed publication(s) to support each highlight. Here we provide a brief highlights from each of the WGs. More highlights of what we're learning will be forthcoming in future communications, as publications continue to come out, and will also be summarized in an overview publication in preparation for the Environmental Research Letters Focus Collection of ABoVE research.

Carbon Dynamics
Non-Growing Season (sometimes referred to as Winter) carbon emissions are a significant fraction of the annual carbon budget and are increasing. Increasing temperatures are extending the season for soil respiration, which may offset increased CO2 uptake by vegetation in the growing season. Non-Growing Season (NGS) CO2 and methane (CH4) fluxes in tundra are increasing with longer duration of the period in spring and fall when water is in a phase transition between liquid and frozen states (the so-called "zero curtain"). There has been a 73% increase in North Slope CO2 emissions in the October - December timeframe, as measured at the NOAA Barrow tall tower since 1979, consistent with increased emissions at the Arctic eddy flux tower near Barrow operating since 1998. This is also consistent with high CO2 and CH4 concentrations observed by airborne data well into November. Trends in modeled carbon budgets for the ABoVE domain show gross primary production offsets net ecosystem respiration losses (i.e,, a net sink), but spatial trend analyses indicate localized landscape vulnerability where ecosystems are moving towards net carbon loss, and increases in CH4 flux along northern boreal transitional zones underlain by permafrost. The C Dynamics WG is interacting with other WGs to reconcile the observations with the models, what they portend for the future C balance of the ABoVE domain, and ultimately their implications for climate feedbacks across the Arctic.

Wildfire Disturbance
Lightning dynamics are a major driver of large fire years within the ABoVE domain. There is evidence that warming is increasing the vulnerability of the taiga-tundra transition region to lightning and fires, which could facilitate treeline migration if seed sources are available and then initiate a positive feedback through regional warming, increased lightning, and fire disturbance. The 2014 mega-fires in the Northwest Territories emitted 94.3 Tg C from 2.85 Mha of burned area, which is equal to about half of the annual carbon sequestration by Canadian boreal forest ecosystems and over ten times the mean annual sequestration of Alaskan boreal forests. Increasing burn severity is affecting forest regeneration and permafrost dynamics, key controls over the post-fire carbon cycle. Deep burning of the soil organic layer is leading to decreased conifer regeneration in boreal Canada and Alaska, potentially shifting ecosystems to alternate successional trajectories such as deciduous forests or open wetlands. Deep burning also increases post-fire depth of thaw and renders permafrost vulnerable to degradation. In boreal Alaska, deeper burning resulted in warmer soils and deeper thaw. In Arctic tundra, post-fire increases in thaw depth took 45 years to return to pre-fire levels. The dynamics of wildfire have implications for carbon balance, vegetation composition, wildlife habitat, permafrost and hydrology, thus cut across ABoVE research themes and working groups.

Vegetation Dynamics
ABoVE researchers are finding growing evidence of ongoing changes in boreal forest productivity even after removing the effects of wildfire. Part of this reflects local shifting mosaics, where changes in hydrology and drainage are linked to vegetation changes across the landscape. Another part is related to forest mortality, especially in older stands and at the southern boreal forest margins where drought, longer-term stress and dieback are linked. A third part reflects large scale shifts in vegetation distribution, with forest densification near the cold edge of forest distribution and dieback near the warm edge. Exploration of landscape scale productivity trends is underway in the tundra portion of the ABoVE domain as well. These analyses have only become possible in the last few years with improved Landsat Surface Reflectance datasets and the ability to process thousands of images in high performance computing environments. Understanding and predicting changes to vegetation is critical for understanding biospheric feedbacks to the climate system.

Hydrology & Permafrost
Integrated model and satellite data analyses confirm widespread permafrost degradation across Alaska. New satellite data-driven model assessments indicate widespread active layer thickness (ALT) deepening across Alaska, affecting approximately 79% of near surface (≤3m depth) permafrost areas over the 2001-2015 record. Driven by recent warming and longer snow-free season trends, permafrost thawing and active layer deepening is particularly intense over central and southwest Alaska, with melt rates exceeding 3 cm yr-1 in some areas. Other model projections of future conditions for Alaska indicate that surface (≤1m depth) and deeper (up to 5m) permafrost layers are vulnerable to being reduced by up to 74% and 55%, respectively, by the end of this century. Changes of this magnitude will have major implications for human infrastructure (roads, pipelines, etc) and, if representative of other Arctic and boreal regions, for climate feedbacks.

Wildlife & Ecosystem Services
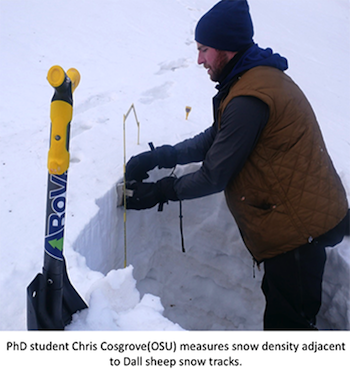
Satellite and field assessments of snowpack properties in mountain sheep habitat show scale-dependent responses of sheep to snow conditions. MODIS time series of normalized difference snow index (NDSI) and MODIS-calibrated SnowModel estimates of snow depth and density provide predictors of Dall sheep movements during the winter at multiple spatial and temporal scales. SnowModel is a spatially distributed snow-evolution modeling system that is an aggregation of four submodels on meteorological forcing conditions, surface energy exchanges, snow depth and snow water-equivalent evolution, and snow redistribution by wind. SnowModel can be run on grid increments of 1m to 10s of km, and at temporal increments of 10 min to 1 day. Including the NDSI metrics substantially improved model performance and informed predictions of winter Dall sheep movements. SnowModel snow depth outperformed NDSI in capturing movements made at finer intervals (<5 days). At these scales, Dall sheep selected for snow depths below mean chest height (<54-cm) when in low density snows (100 kg/m3), which may facilitate access to ground forage and reduce energy expenditure while traveling. However, sheep selected for higher snow densities (> 300 kg/m3) at snow depths above chest height, which likely further reduced energy expenditure by limiting hoof penetration in deeper snows. NDSI described movements best at intervals longer than ~5 days. Thus, use of publicly available, remotely sensed snow cover products can substantially improve models of animal movement, even when such products were not developed for the specific purposes of animal movement modeling. Analyses of other species and how their movements relate to snow properties is ongoing.

Modeling
It is well known that models are deficient in representing Arctic-Boreal ecosystem processes (for instance, results from warming experiments contradict projections from the 5th Carbon Model Intercomparison Project, CMIP5), but the data requirements had not previously been quantified and delineated across the modeling community. A survey of 18 modeling teams compiled the data most needed to advance modeling in Arctic-Boreal ecosystems, as follows: [Tier 1–top priority] soil carbon, net primary production, biomass, soil moisture, plant functional type discrimination, and gross primary production; [Tier 2–secondary priority] soil respiration, litter mass, active layer thickness, freeze/thaw dynamics, net ecosystem exchange, soil temperature, evapotranspiration, water table, permafrost, soil vertical profiles, and leaf area index. Specific areas within the ABoVE domain were identified as locations with high model uncertainties. A roadmap has been defined using this information to outline the steps and timeline required to significantly advance community modeling performance of Arctic-Boreal ecosystem processes. These include 3 overarching steps: (1) data variable x-to-model variable y translation, (2) an operational benchmarking system that can help identify needs for additional field data collection, and (3) structured model development, as in numerical weather prediction, to move models to hit benchmarks, improve uncertainties, and address societal needs

View Working Groups

Sites and Products for ABoVE – please update!


In order to plan a coordinated campaign, ABoVE investigators have asked to know where and when each other are working, and what data products are being created and archived. There are tools on the ABoVE website (and tool tutorials) so that investigators can update their information. See an overview of the ABoVE data workflow here.

Update Your Sites and Measurements!
ABoVE investigators conducting fieldwork should plan to create data collection events using the ABoVE Sites and Measurements Tool. View our video tutorial.

Update Your Data Products!
All ABoVE investigators should use the ABoVE Project Profile Update Tool to create metadata records describing planned data products for publication, integration, synthesis, and modeling. View our video tutorial. Contact support@cce.nasa.gov with any questions about the ABoVE website tools.

Archive Your Data!
Archiving (and thus publishing) data is an essential part of science team membership (see ABoVE Data Policy). All data products created with NASA funding will be archived at a NASA archive center (e.g. ORNL DAAC). Some affiliated projects may also choose to archive data contributed to synthesis activities. When you submit data, ORNL DAAC staff will perform quality checks on the data, write documentation, and will assign a permanent DOI and citation to your data, allowing you to track its re-use. A guide to publishing data is available, as is information on Best Practices for Data Management. Start your submission to the ORNL DAAC today


Recently-published ABoVE data:

Browse ABoVE data at the ORNL DAAC

See all archived ABoVE data at NASA Data Centers in the Earthdata portal

March 2018 Wrangell Mountain Expedition Report
Laura Prugh — 29 March 2018

ABoVE Science Team,

On March 14, four members of the NASA ABoVE Dall sheep project (lead PI Laura Prugh and PhD students Chris Cosgrove, Ryan Crumley, and Molly Tedesche) headed into the Wrangell Mountains for a week-long field expedition to conduct snow surveys. These snow surveys are critical to the project's goal of understanding how snow conditions are changing and affecting Dall sheep in northern alpine regions. Riding snowmobiles for more than 20 miles into the wilderness, breaking trail and clearing brush for the last 5 miles (and sometimes getting stuck), the crew set up base camp in an open meadow. It turned out this meadow was home to a resident bull moose, who kept a respectful distance and was often seen browsing nearby. Snow levels were unusually high this year, making for a useful contrast to last year's surveys and giving team members a good snowshoeing workout. Navigating through deep snow, thick brush, and over steep terrain, the team recorded snow depth using a Magnaprobe, dug snow pits to examine the snowpack stratigraphy (layering over the season), and measured snow track sink depths of Dall sheep and one of their main predators, coyotes. The team was able to reach 17 of the 22 sites that had been established in September to record snow depth every hour using game cameras and snow stakes; the remaining 5 sites were in terrain that was unsafe to reach due to avalanche danger.

chris cosgrove

The team's luck with clear, warm weather broke on the last day of fieldwork. Amid a snowstorm that was picking up momentum, Prugh spotted an area with a maze of coyote tracks and what appeared to be the faint traces of white fur on the snow. Investigation confirmed the site was a sheep kill, and Prugh quickly dug a pit to record the snow characteristics that may have contributed to the sheep's demise. Perhaps the snow was dense enough for the coyotes to run on top of the snowpack, whereas the sheep, with a heavier body mass and small hooves, floundered in the deep snow?

Fortunately, the snowstorm ended overnight, and the crew awoke to blue skies overhead and 8 inches of fresh powder blanketing the spectacular landscape. Analysis of the field data over the coming year will improve efforts to model and map snow characteristics across the mountainous region and reveal how snow properties affect the vulnerability of Dall sheep to predation.

Permafrost Coring Campaign 2018 March-April in the Anaktuvuk River Fire area


Go Iwahana
University of Alaska Fairbanks
April 12, 2018

Go Iwahana's team successfully conducted a 15-day permafrost coring field expedition for his NASA ABoVE project "Quantification of Thermokarst and Carbon Release in Ice-Rich Permafrost Regions" from March 25 until April 8. In 2007 summer, the Anaktuvuk River Fire burned more than 100,000 ha of tundra underlain by highly ice-rich permafrost (Yedoma). Subsequent warming has increased permafrost degradation associated with ground subsidence due to ground ice loss (thermokarst). Better characterization of the contents of the degrading permafrost, including melting ground ice, is essential to make better estimates of carbon and water release after the permafrost thaw. Back in Fairbanks, the Iwahana team will analyze the samples for greenhouse gas, organic matter, and ice content, together with cryostructure of permafrost. The analysis of results will be combined with remote sensing measurements of thermokarst development in this area.

A logistics support team from Toolik (Jeb Timm, Garrett Jones and David Hamilton) broke a snow trail by snowmachine to the base camp site, which was located 75 miles north of the Toolik Field Station. Science leads Go Iwahana and Benjamin Jones followed the trailbreakers, hauling more than 2,000 lbs. of camp and sampling gear. After a couple of chilly days of hauling, unusually warm and calm weather (but still frozen ground) allowed easy setup of the camp site and deep coring system. The team recovered a 10.7 m core at an unburned patch of Yedoma hill within the fire scar area and plan to instrument the borehole for future monitoring of the ground temperature profile.

Cold air temperature down to -25°F came back in the second week, during which the fieldwork was supported by ABoVE logistic Sarah Sackett and a UAF student Reyce Bogardus. In addition to the 10m deep core, ten 1-2.5 m cores in total were cored at various land covers including burned and unburned Yedoma hill and thaw lake basin and block samples of ground ice were collected from a permafrost bluff during the two weeks. The frozen samples were safely transferred to UAF laboratory for analyses.

Building camp site on a frozen lake.

Setup of mobile deep coring system.

Measuring and describing sampled cores.

Team Iwahana, week two.

LVIS


Data collected for ABoVE in 2017 by NASA's Land, Vegetation, and Ice Sensor (LVIS) is now available at the National Snow and Ice Data Center (NSIDC). LVIS is a high-altitude, waveform-recording lidar system and collected data within a ~1.6km-wide swath using ~6m-wide footprints along flight lines in Alaska, the Yukon and Northwest Territories and Alberta and Saskatchewan in June and July 2017. By mission end, LVIS collected over 340 million laser return waveforms from the ground surface along with over 30,000 co-located camera images. LVIS lidar data are processed to produce footprint-level elevation and height measurements as well as metrics describing surface structure (the LVIS Level2 product). The laser return waveforms are geolocated to provide a true 3-dimensional representation of the surface structure within each footprint (the LVIS Level1B product). Camera images are tagged with date, time and positioning information. A description of the data products as well as maps of flight tracks can be found at lvis.gsfc.nasa.gov/Data/Maps/ABoVE2017Map.html. All LVIS Level1B, Level2 and camera data are hosted at the NSIDC and discoverable through the centralized data search portal of ABoVE.

LVIS
Downlooking 3km x 2km photo of the Mackenzie River Delta between Aklavik and Inuvik taken on June 30th 2017 by the LVIS camera system from ~28,000'. Pixel size is ~0.4m.

New Projects

2 New ABoVE Projects

View Projects

New Publications

13 New Publications in 2018

View Publications

Science Cloud Data

Multiple large data collections available

Go to Data

Data Products

13 New Data Products in 2018

View Data Products

ABoVE Jobs

Multiple job openings with ABoVE Projects. If you would like to post a position, email support@cce.nasa.gov.

View Job Openings

Calendar

LVIS LVIS